30
25
20
15
10
5
0
Shipments inmillionunits
1
2008 2009 2010 2011 2012 2013* 2014* 2015* 2016*
3.8
10.1
23.2
14.9
10.9
8.7
7.8
7.1
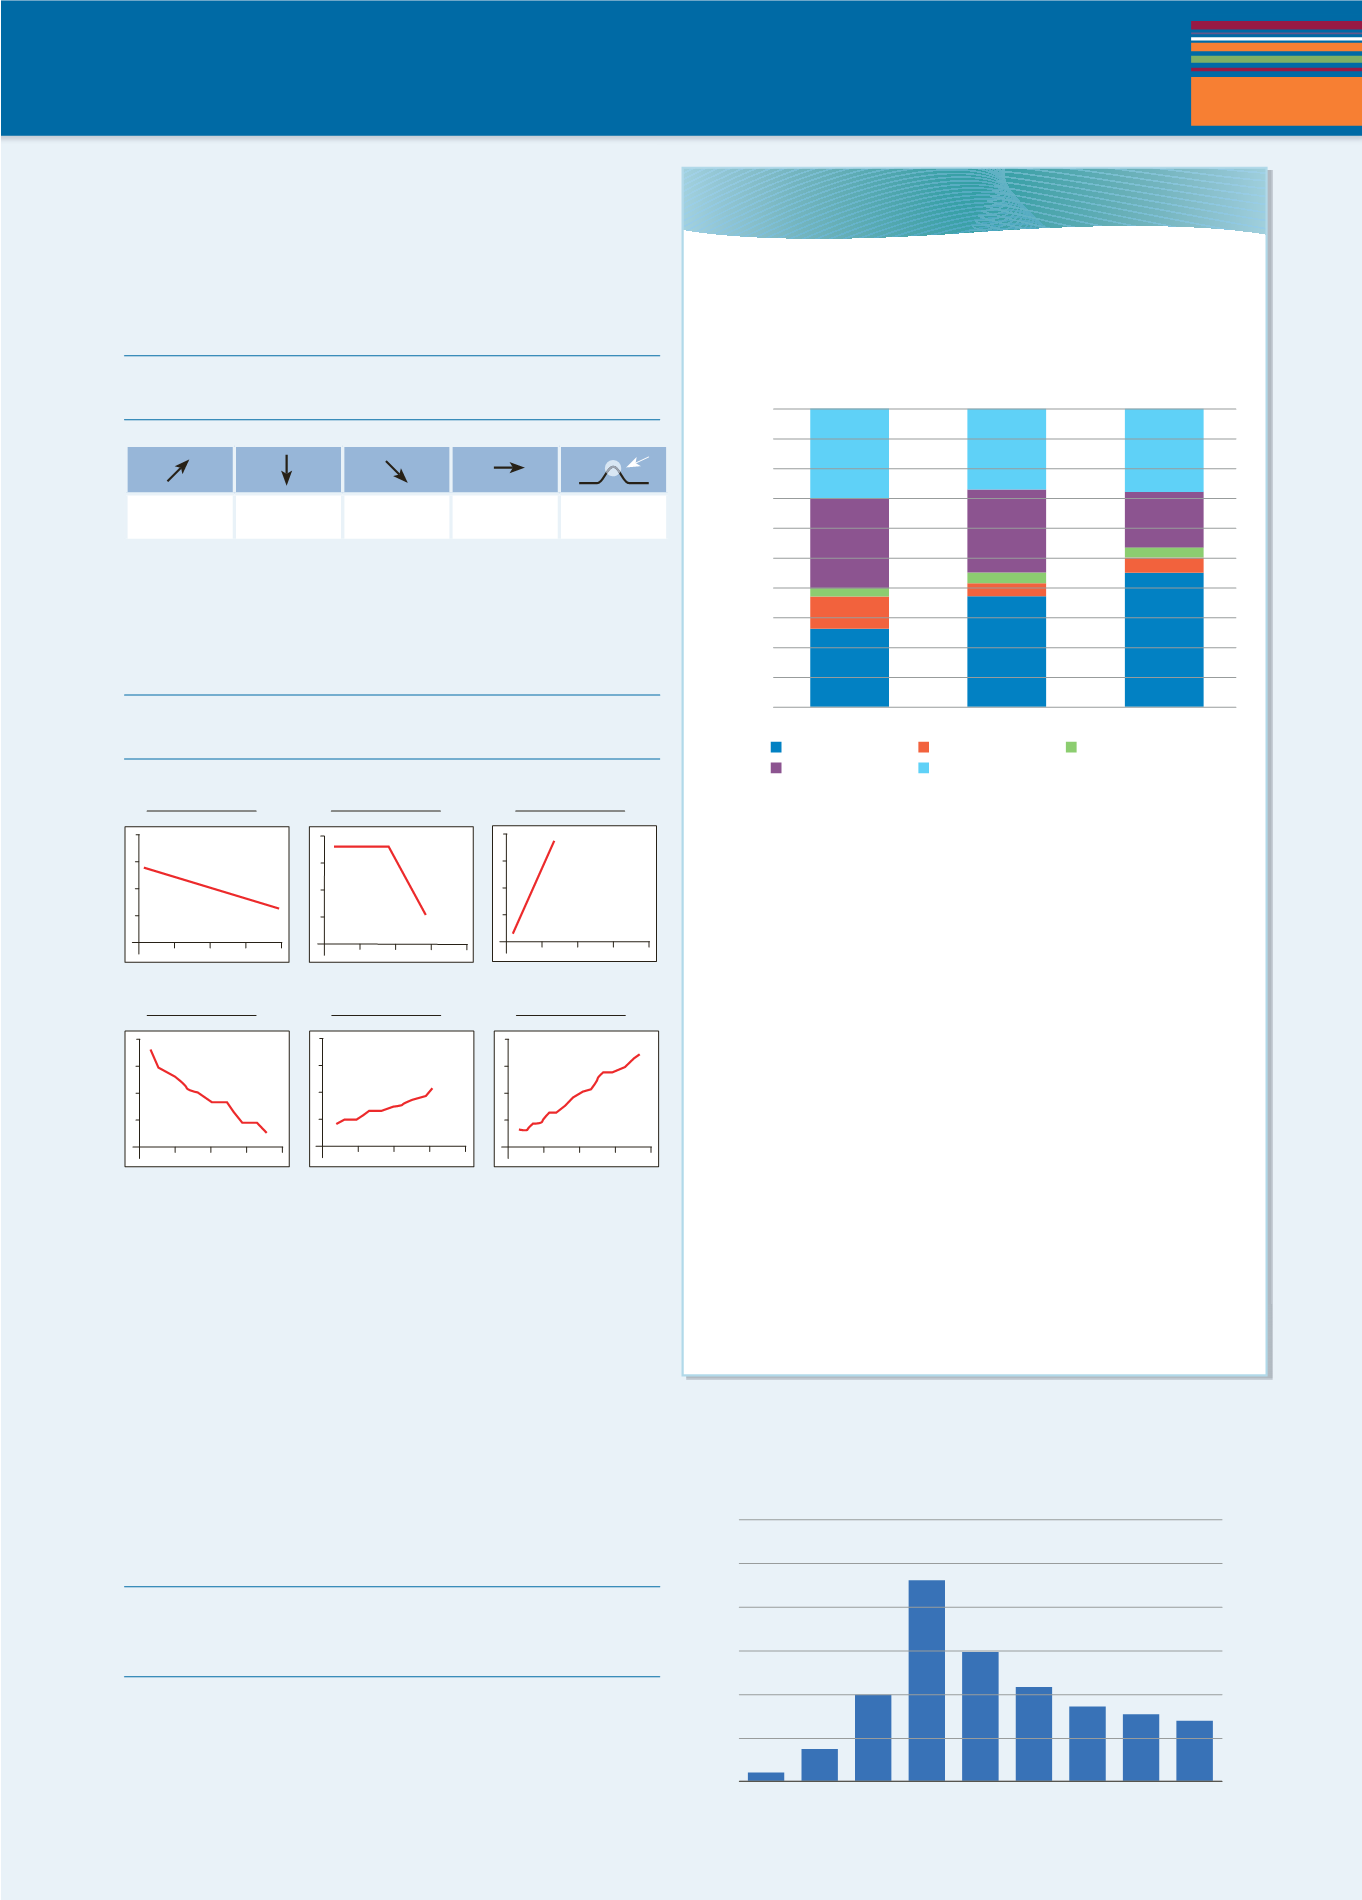
2010
2011
2012
100%
90%
80%
70%
60%
50%
40%
30%
20%
10%
0%
Digital Downloads
Large Chains
Book Clubs
Other Outlets
Independent Bookshops
29.6%
27.0%
27.7%
31.4%
25.3%
11.2%
6.2%
5.4%
3.8%
3.8%
28.6%
35.2%
18.4%
43.9%
2.5%
STUDY AND WRITING SKILLS
105
10.5
WRITING SKILLS
DESCRIBING A TREND
7
a
Complete the table with the words and phrases in
the box. Use a dictionary to check whether each word
or phrase is a noun, a verb, or both.
increase drop decline level off rise fall peak
grow go up decrease stabilise remain stable
7
b
Describe each of the graphs below, using an
adjective from the box and a noun from Exercise 7a.
Use a dictionary to help you decide which words
collocate. There may be more than one possibility.
dramatic significant steady sharp slow
gradual slight sudden
1
This chart shows the
results
of a study
carried out
for the
Publishing Industry Association into spending in book retailers
in the USA. The
study
compares spending from 2010 to 2012
across several different outlets for books: digital downloads,
book clubs, independent bookshops and large chains.
12
Look at the chart below showing trends in US sales
of e-book readers. Write a description of the changes
the chart shows. Use the description above as a model
and the words and phrases from Exercise 7.
8
Read the extract from a report on the dramatic change
in spending on books between 2010 and 2012 on the right.
Match each paragraph with its purpose.
a
gives the main trend
b
gives the conclusion
c
gives more detail and any surprising or opposite trends
d
gives the source of the information and what it shows
9
What do you think will happen in the future to
music sales?
10
Avoiding repetition
Read the report again and
replace the words in bold with the words and phrases
in the box.
conducted findings finds largest decrease
a marked fall relatively stable small
sudden decrease survey twice as much as
11
Which verb tenses are used in the report to
indicate changes? Find some examples.
What does the future hold?
2
Overall, the survey
shows
that after reaching a peak in 2010
spending on books in large chains has been falling. Spending
on books in large chains in 2010 was nearly
double
the
amount in 2012, which represents a
sharp drop
in revenue
for the big stores.
3
Between 2011 and 2012 there was a
slight
increase in the
sales of books through book clubs. However, from 2010 to
2012 there was a
fairly constant
rise in the sale of digital
downloads, and this is expected to continue to be the fastest
growing sector in the market. Interestingly, the difference in
the price of books from different outlets during this period
remained largely unchanged, as cheaper digital downloads
were matched by heavy discounting in large chain shops and
supermarkets.
4
In summary, spending on books in the US has not shown
any
significant decline
since 2010, but there has been a
significant shift from customers buying printed books to
buying digital downloads. It could be that we are now seeing
the
greatest fall
in spending on printed books since the
industry began.
1
2
3
4
5
6
slow fall


