100,000,000
200,000,000
400,000,000
600,000,000
800,000,000
1 billion
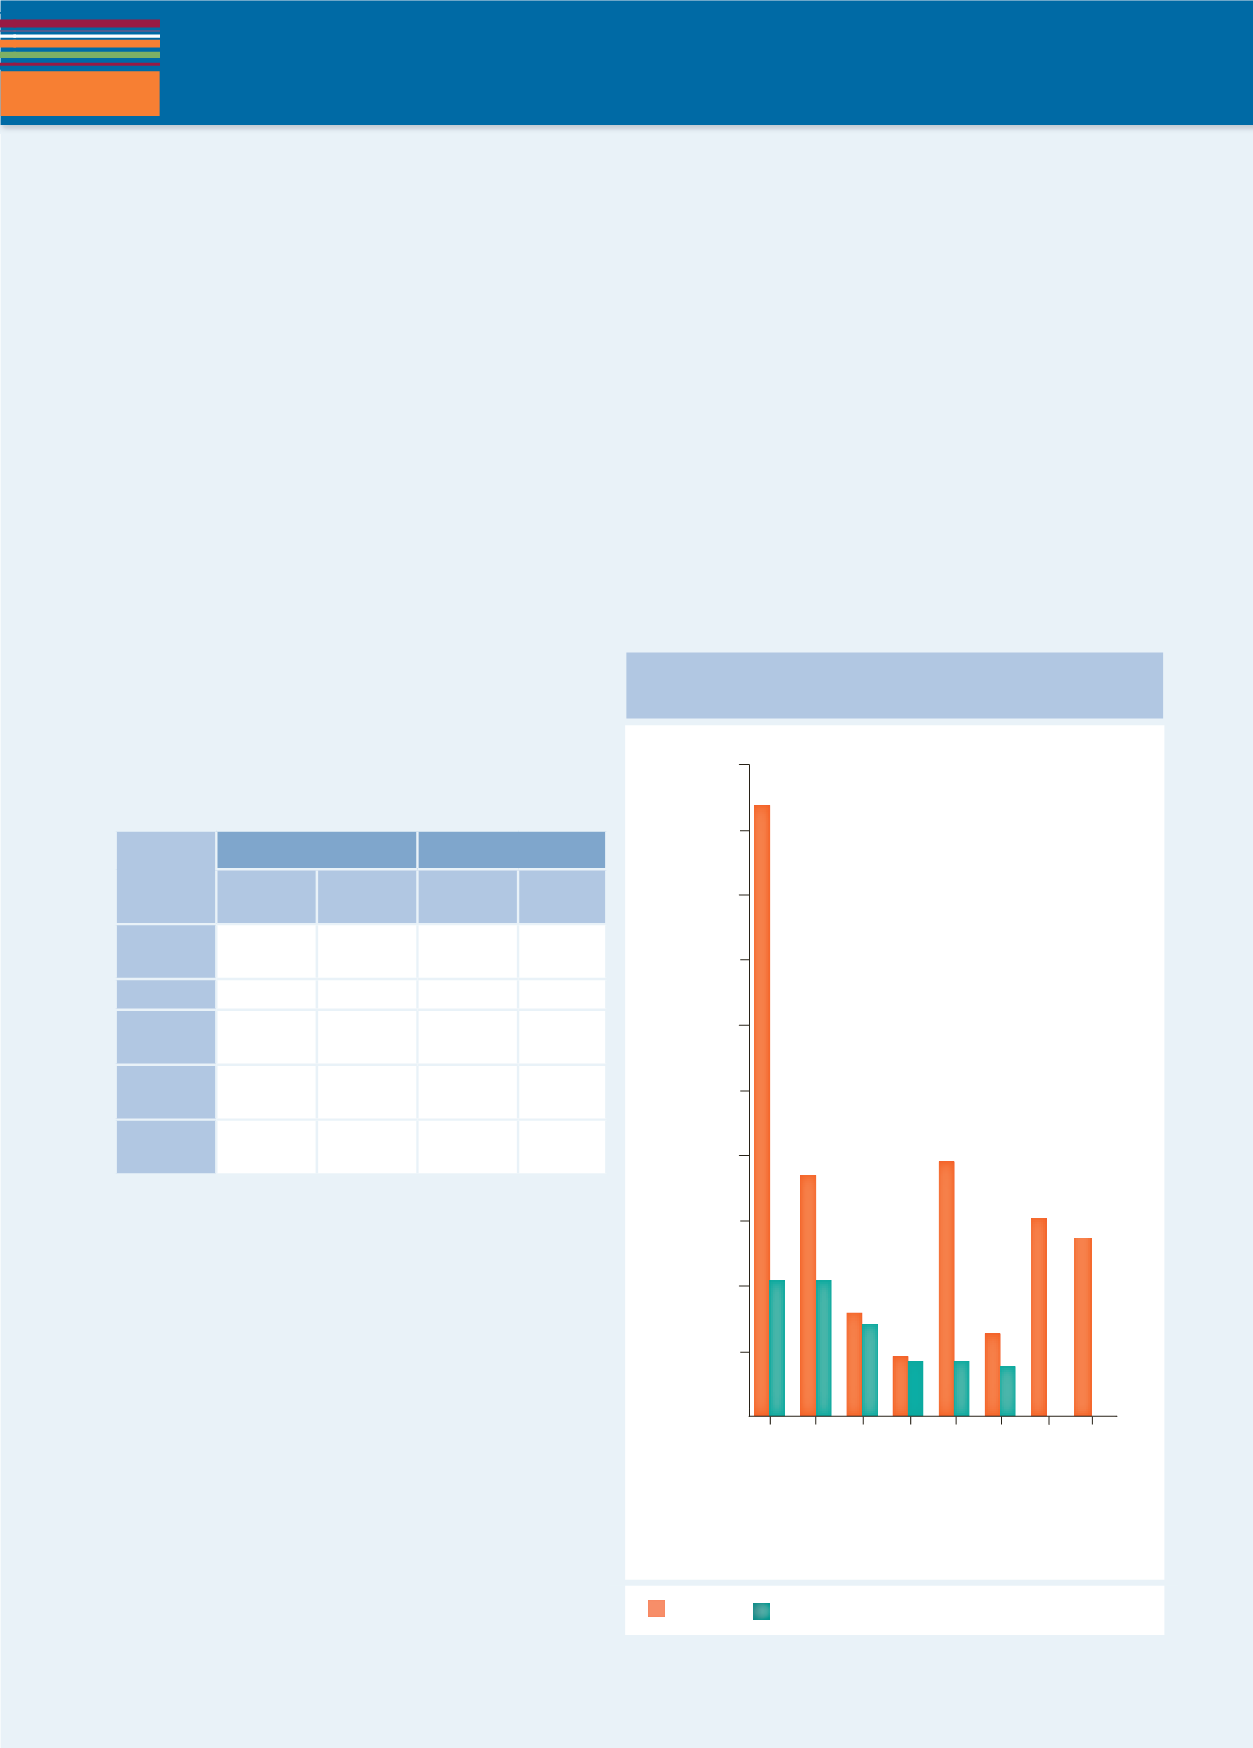
Arabic
Hindi
Japanese
Spanish
German
Russian
English
Chinese Mandarin
300,000,000
500,000,000
700,000,000
900,000,000
STUDY AND WRITING SKILLS
44
4.5
STUDY SKILLS
DESCRIBING CHARTS AND TABLES
1
Where do you usually see charts and tables in your
everyday life? How often do you need to look at or use
them? For what reasons?
2
Match the percentages and the fractions.
1
67%
a
just under a quarter
2
32%
b
just over two thirds
3
75%
c
slightly less than a third
4
23%
d
just over half
5
52%
e
(exactly) three quarters
6
48%
f
more than three quarters
7
80%
g
approximately three quarters
8
74.5%
h
almost half
3
Answer the questions.
1
Which of the following is a
majority
?
a
32%
b
24%
c
77%
2
Which of the following is a
minority
?
a
21%
b
83%
c
91%
4
Look at the table showing results from 100 student
questionnaires at a university language centre last
year and this year on student satisfaction in two areas:
teaching and facilities (buildings, rooms, equipment).
Teaching
Facilities
Last year
This year
Last year
This
year
Very
satisfied
51
65
32
10
Satisfied
24
24
38
52
Quite
satisfied
10
6
20
25
Not
satisfied
12
2
8
12
No
opinion
3
3
2
1
Look at the results for last year. Are these statements
true or false? Correct the false statements.
1
Approximately half the students were very satisfied
with the teaching.
2
Ten percent of the students were quite satisfied with
the facilities.
3
Just under two thirds of the students were very
satisfied with the facilities.
4
Almost a quarter of the students were satisfied with
the facilities.
5
The majority was very satisfied or satisfied with
teaching and facilities.
6
A small minority had no opinion about teaching and
facilities.
7
More than a quarter weren’t satisfied with the
teaching and facilities.
5
Look at the results for this year. Work with a
partner and write some true/false statements like in
Exercise 4. Give them to another pair to answer, then
check their answers.
This year almost two thirds of students were very
satisfied with the teaching.
6
Look at the chart below for 20 seconds and choose
the best summary.
a
This chart shows the number of native and second
language speakers of some different languages.
b
This chart shows the percentage of speakers of a
number of different languages over some years.
c
This chart compares the number of native speakers
of important world languages at two different points
in time.
d
This chart shows some changes in eight languages
and the number of native speakers from fifty years
ago and now.
Approximate number of native speakers of languages
50 years ago and today
Today 50 years ago


